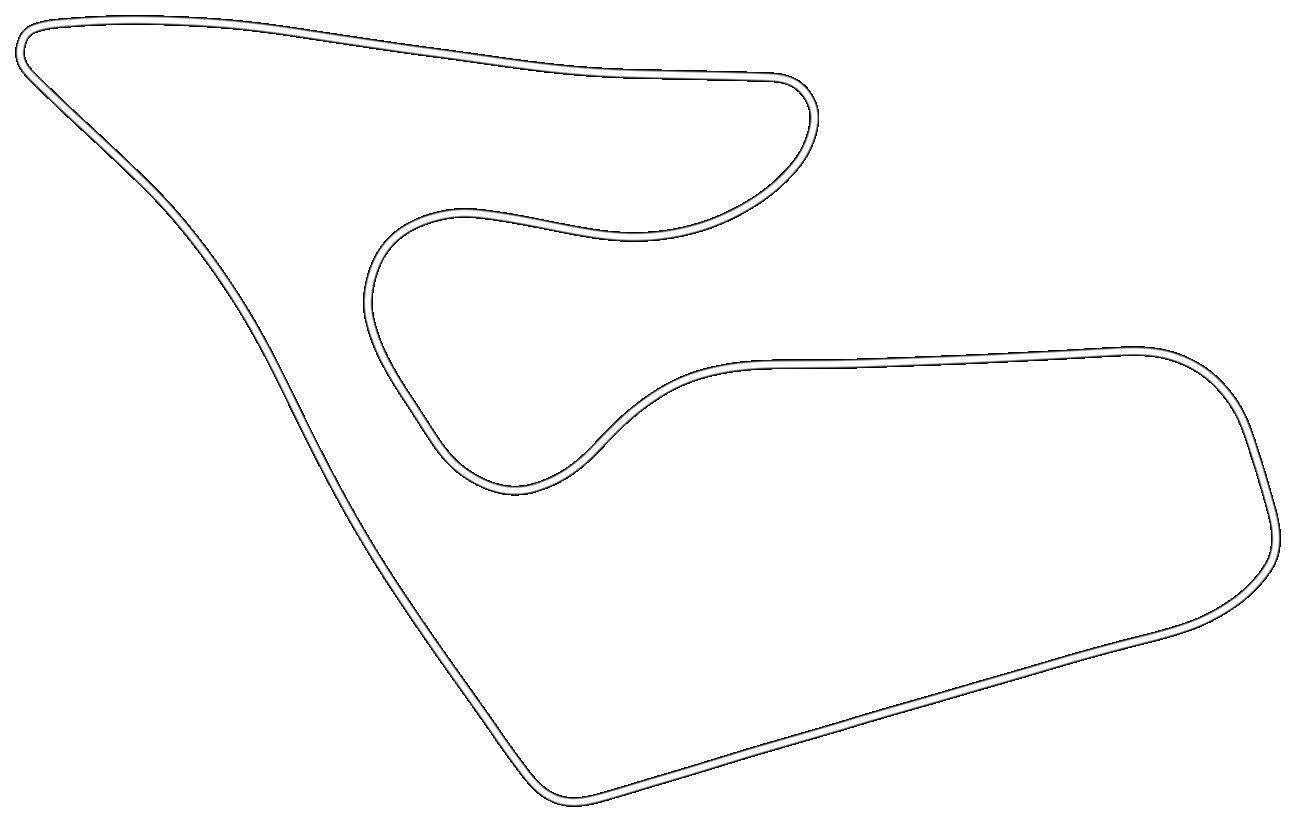
Red Bull Ring GP
12 Jul 23 19:44 EEST
Back to Results
Overview
Race
Open in Simresults
Download as JSON
L/S = Overall Best Lap/Sector
L/S = Driver's Best Lap/Sector
| # | Name | Car | Total Race Time | Num Laps | Best Lap | Average Clean Lap | Collisions | Ping |
|---|---|---|---|---|---|---|---|---|
| 1 | The Red Fox | Lamborghini Huracan GT3 | 00:22:00.812 | 13 laps / 0 cuts |
01:35.880 Tyre: M |
01:41.474 | 5 | 6 - 2449 |
| 2 | Senbonzakura (140icq) | Audi R8 LMS 2016 | 00:22:19.153 | 13 laps / 0 cuts |
01:39.011 Tyre: H |
01:40.764 | 1 | 2 - 1227 |
Car
Env
Rel
There were no penalties in this session.
1st The Red Fox
in
Lamborghini Huracan GT3
Best:
01:35.880,
Potential: 01:33.975
| Lap # | Race Position | Lap Time | Sector 1 | Sector 2 | Sector 3 | Cuts | Tyre |
|---|---|---|---|---|---|---|---|
| 1 | 1 | 01:43.122 | 00:27.962 | 00:40.244 | 00:34.916 | 0 | M |
| 2 | 1 | 01:39.180 | 00:21.595 | 00:40.117 | 00:37.468 | 0 | M |
| 3 | 1 | 01:36.758 | 00:22.787 | 00:39.025 | 00:34.946 | 0 | M |
| 4 | 1 | 01:41.477 | 00:21.278 |
00:38.858
S
S
|
00:41.341 | 0 | M |
| 5 | 1 |
01:35.880
L
L
|
00:21.234 | 00:39.915 | 00:34.731 | 0 | M |
| 6 | 1 | 01:49.043 | 00:21.203 | 00:43.372 | 00:44.468 | 0 | M |
| 7 | 2 | 01:48.173 | 00:33.865 | 00:39.456 | 00:34.852 | 0 | M |
| 8 | 2 | 01:45.528 | 00:31.080 | 00:39.825 | 00:34.623 | 0 | M |
| 9 | 2 | 01:37.695 | 00:21.689 | 00:41.851 | 00:34.155 | 0 | M |
| 10 | 1 | 01:36.768 | 00:21.244 | 00:39.766 | 00:35.758 | 0 | M |
| 11 | 1 | 01:35.904 | 00:22.657 | 00:39.172 |
00:34.075
S
S
|
0 | M |
| 12 | 2 | 01:47.055 | 00:23.053 | 00:39.591 | 00:44.411 | 0 | M |
| 13 | 1 | 01:44.237 |
00:21.042
S
S
|
00:39.356 | 00:43.839 | 0 | M |
2nd Senbonzakura (140icq)
in
Audi R8 LMS 2016
Best:
01:39.011,
Potential: 01:37.369
| Lap # | Race Position | Lap Time | Sector 1 | Sector 2 | Sector 3 | Cuts | Tyre |
|---|---|---|---|---|---|---|---|
| 1 | 2 | 01:46.424 | 00:28.579 | 00:41.450 | 00:36.395 | 0 | H |
| 2 | 2 | 01:41.171 | 00:23.479 |
00:40.532
S
|
00:37.160 | 0 | H |
| 3 | 2 | 01:39.065 | 00:22.264 | 00:40.918 | 00:35.883 | 0 | H |
| 4 | 2 | 01:40.222 | 00:21.927 | 00:42.038 | 00:36.257 | 0 | H |
| 5 | 2 | 01:39.069 | 00:21.799 | 00:40.950 | 00:36.320 | 0 | H |
| 6 | 2 | 01:41.511 | 00:22.634 | 00:42.638 | 00:36.239 | 0 | H |
| 7 | 1 | 01:39.058 | 00:21.635 | 00:41.324 | 00:36.099 | 0 | H |
| 8 | 1 | 01:48.437 | 00:22.380 | 00:50.674 |
00:35.383
S
|
0 | H |
| 9 | 1 |
01:39.011
L
|
00:21.454
S
|
00:40.729 | 00:36.828 | 0 | H |
| 10 | 2 | 01:41.712 | 00:22.534 | 00:43.429 | 00:35.749 | 0 | H |
| 11 | 2 | 01:39.990 | 00:22.477 | 00:41.557 | 00:35.956 | 0 | H |
| 12 | 1 | 01:39.166 | 00:22.409 | 00:41.059 | 00:35.698 | 0 | H |
| 13 | 2 | 02:04.323 | 00:22.024 | 00:40.909 | 01:01.390 | 0 | H |